
Getting Started
This activity has been developed by the Faulkes Telescope Project.
Supernovae mark the end of a star's life. Here you will find some materials that will help you learn about them and show you how to measure one for yourself and see how it fades over time.
Work your way through each of the sections below in order to create a light curve for the Gaia supernova target Gaia16agf.
In section 6 you will find some guidelines for the teacher.
1 What is Gaia?
This section contains some background information about the Gaia satellite and the Gaia Science Alerts. These information sheets will introduce students to the mission and its objectives.
2 Background Science
This area contains general introductory information to some of the science topics that are involved in supernovae and photometric measurements. Students should read through these in order to gain an understanding of what it is they’ll be doing and the science behind it.
 Stellar Lifecycles PDF document
- An Introduction to Supernovae PDF document
- Photometry in Astronomy PDF document
- Calculating Magnitudes PDF document
3 Instructions
These materials will guide students through how to perform photometry on a supernova target and plot a light curve in order to see how the object fades over time.
There are instructions for two different software packages, SalsaJ and Makali'i. It is up to you which one you use and you can find the free download links within the instructions.
You will need to complete the Photometry with SalsaJ/Makali'i worksheet first before starting the Supernovae with SalsaJ/Makali'i worksheet.
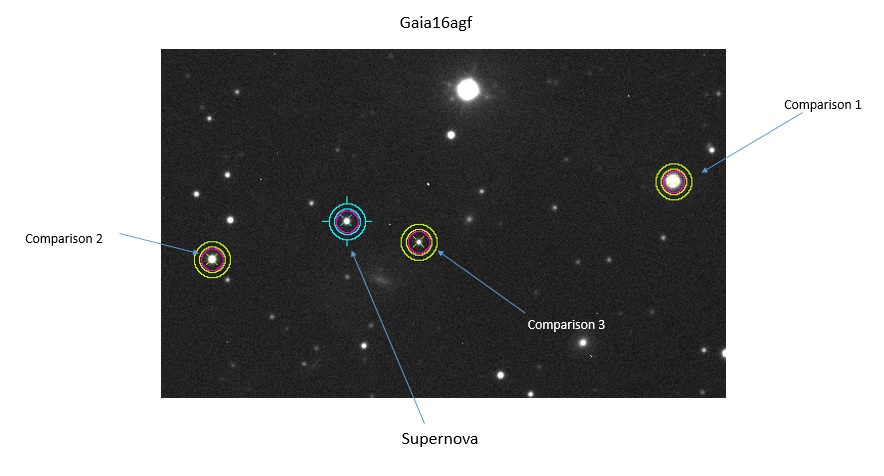
You will also find a 'Finder Chart' which they will need to use in order to identify the supernova target and comparison stars. You will also find a spreadsheet titled 'Observation Information' (this will all become clear as you proceed through the instructions).
- Photometry with Makali'i PDF document
- Supernovae with Makali'i PDF document
- Photometry with SalsaJ PDF document
- Supernovae with SalsaJ PDF document
 Finder Chart file
 Observation Information Excel spreadsheet
 Finder Chart file
4 Data - Gaia16agf
Here you will find a zip folder containing the observations of the Gaia target that students will be analysing. There should be 17 images in this folder and they are named according to their date of observation. For example, "1 – 20160302" is the first observation in the data set and was taken on the 2nd March 2016.
 Gaia16agf zip archive (11 MB)